Callout | Region | Description |
|---|---|---|
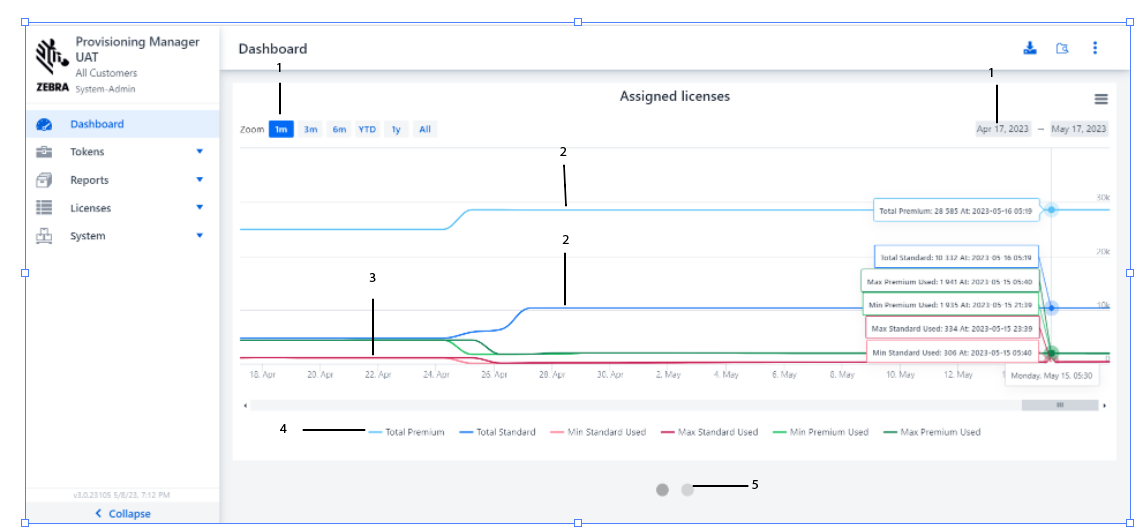
1 | Assigned Licenses graph: Range Selector | Select the date range to be displayed in the License Utilization report, either by clicking a predefined range in months (for example, 1m, 3m, 6m) or by specifying the date in the calendar drop-down in the top right corner of the Assigned License screen. YTD, 1Y, and ALL button display the data only up to 6 months. If you wish to view data for 1 Year, you can slide the slide-bar towards right side. |
2 | Assigned Licenses graph: License Utilization Reports | Displays the License Utilization reports for Premium Used, Premium Total, Standard Used, and Standard Total. |
3 | Assigned License graph: Report Toggle | Displays the date based on the date selected in the Range Selector bar. |
4 | Token Requests graph: Token Utilization Reports | Select one of the License Utilization report types to turn the display on and off for the selected type ( Premium Used, Premium Total, Standard Used, and Standard Total). |
5 | Token Requests graph: Report Toggle | Select one of the Token Utilization report types to turn the display on and off for the selected type. Reports can be toggled by Zebra application (Zebra Voice, PTT Pro Android, PTT Pro Windows, Zebra Profile Client, PTT Pro iOS, and Zebra Central). |