Section | Description |
|---|---|
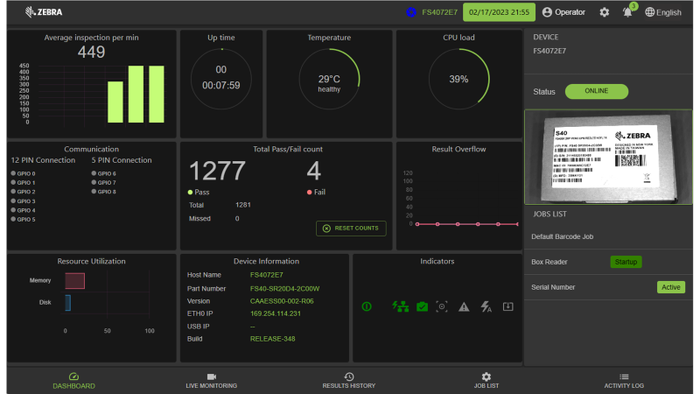
Average Inspection Per Minute | Displays the number of scans per minute. |
Up Time | Displays the total time the device has been running in a given session. |
Temperature | Displays the operating temperature of the device. |
CPU Load | Displays the current number of processes executed by the CPU. |
Communication | Displays the pinout configuration of the GPIO. |
Total Pass/Fail | Displays the total number of successful and unsuccessful reads. |
Resource Utilization | Provides the resource utilization by memory and disk. |
Device Information | Provides device information such as Host Name, Part Number, Version, Ethernet IP, and Build number. |
Indicators | Displays the LED status indicators on the device. |